
What are the Average Returns on Cash Value Life Insurance?
We’re often asked “what are the average returns on a cash value life insurance policy? Or what can I expect it to grow to over time?
To be clear, from a compliance standpoint life insurance is not classified as an investment. It’s similar due to tax-free cash value earnings growth, but its classified as life insurance for compliance purposes.
However, you do want to know the potential growth of a cash value insurance policy before making an informed financial decision. Today, we’re reviewing historic cash value insurance growth with different companies and products. We’re also going to compare historical IRR growth to a properly designed present day whole life insurance policy. We’ll cover policies designed with earnings guarantees and how dividends come into play.
Historic Cash Value Insurance Returns
We often hear that cash value growth shouldn’t matter because an insurance policy is not about cash value growth, but for life insurance. While the statement rings true, if you’re going to put money into any financial product; you want to know how that money is going to grow over time. What’s my IRR going to be?
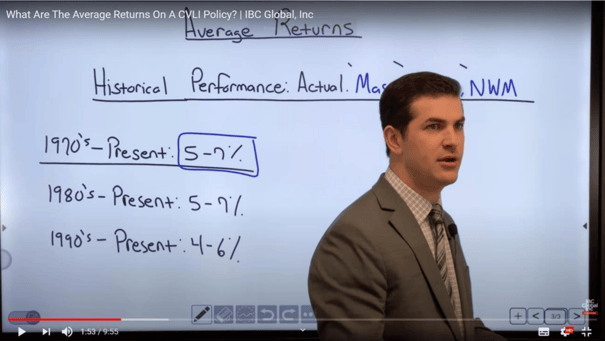
What we're going to look at today is the historical performance of two life insurance majors namely, Mass Guardian and Northwestern Mutual. We have this word “actual’ in the screenshot below. The reason is that before we commit to fund a whole life insurance policy, we are presented with a projection of what we can expect in cash value growth and IRR over time.
So, we want to see actual results; what happened with the policy based on actual performance? Not dividend shares, but actual cash value yields or internal rate of return (IRR). The cash value life insurance studies we’re going to review today are actual results of Mass Guardian and Northwestern Mutual from the 1970s through to present day.
Whole Life Insurance Returns 1970 to Present Day
In the screenshot below, we see that from the 1970s to present day, whole life insurance policies produced an overall average internal rate of return between 5% – 7%. The question arises “is that yield taxable?” The answer is “not necessarily.” A cash value insurance policy can result in tax-free growth if professionally designed. Further, the policy has be designed not to trigger a MEC or Modified Endowment Contract which limits the annual premium payments in compliance with the Internal Revenue Code of the IRS.
Again, from the screenshot below, we see that from 1980 to present day resulted in the same average returns as the 1970s. I saw a lot of policies fall in the 6% range or high 5%, but still between 5% and 7%.
In the 1990s through present you see a drop to between 4% to 6%. The reason is that through the 70s and 80s interest rates spiked to double digits reaching 21.5% in 1982. Afterword, interest rates started to drop from the 80s into the 90s, and so too did the IRR of a cash value life insurance policy.
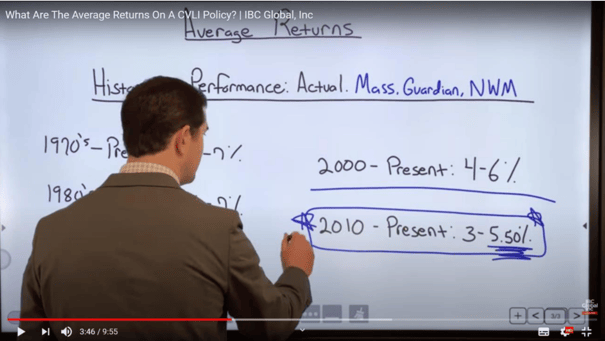
In the screenshot below, we have the average returns from 2000 to present and 2010 to present. From 2000 to present we still see that cash value policies ranged from 4% to 6%.
Now, here's where it starts to get interesting. Between 2010 and present, I've seen average returns between 3% and 5.5% because the cash value policy isn’t designed properly.
A 3% return is much more recent due to the state of the economy. If a policy is not designed properly, or if we focus purely on the guarantees, we see lower IRRs. But I did put it at 5.5%. Could we see some policies produce 6 percent? Possibly, but better to shoot conservative at 5.5% and see an IRR of 6% rather than predicting 6% and have it come in at 5.5%. It’s always better to be conservative in our projections, particularly in the current economic climate.
These studies, to be clear, are based on whole life policies we put in force back in 2014 through to present day.
When I look at a life insurance policy, I want to be sure actual performance is good so I know what I can expect. I don’t want to tell you it should produce a high return and then have actual returns come in much lower. When I look at these companies or any insurance carrier, my expectation is 3% to 5.5%.
Cash Value Dividends Based on Investment Returns
Okay, so you’re guaranteed 4% IRR. But I'm not expecting it to go back up to 5% or 6%. When you look at the dividend or surplus, it's based on the insurance company's investment performance. They are investing cash proceeds to drive returns to generate a surplus. It’s this surplus that is dispersed to policy holders in the form of dividends. Because insurance companies invest in low-risk, safe investments, returns become lower as interest rates decline which generate lower surpluses leading to lower dividends.
So, if rates decline, I want to know what my actual cash value will look like moving forward. If I have a dividend of 6%, what's my net cash value going look like? The IRR for dividends is not 6%. Remember that a dividend is a gross rate credited to your cash value account after insurance expenses and mortality charges. So, my net IRR might fall around 4% to 4.5%.
So, let's demonstrate this.
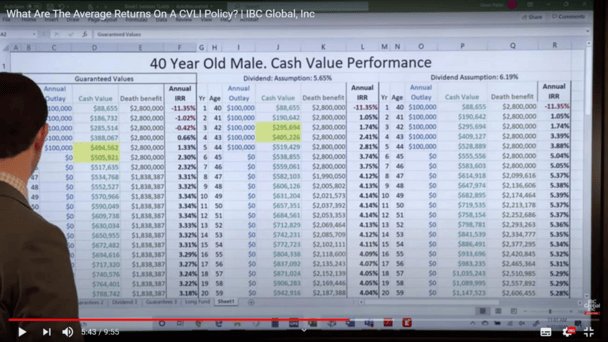
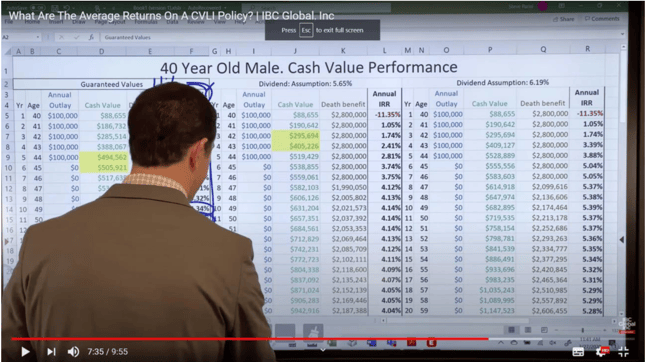
In the table above, we have an example of a whole life insurance policy for a 40-year-old male. This gives you a nice projection of what can happen in different scenarios. On the far right, you’ll see the Dividend Assumption of 6.19%. Then you have a Dividend Assumption of 5.65% percent for the scenario in the center. And then you have the pure Guaranteed Values on the left at 4%.
In this scenario, we only fund it for five years or 100K per year across all scenarios. If we fund for a longer period, you'll see stronger cash values because we're covering more of the insurance expenses. So, we could make this look better, but it's not really the point. What I want to stress are the actual yields with guarantees of 4%.
In the scenario on the left, you’ll see the Annual Internal Rate of Return (IRR) in Column F. This does not account for the average return over time. If you scroll down Column F, you see that the yield in the 8th year is 3.31% and remains around 3% to 3.5 % throughout. That's where I’m coming up with that 3% to 5.5%. With a properly designed whole life policy, I know the worst-case scenario is 3% to 5.5%. It's a bit over 3%, and I know I'm going to get that return.
With bank interest rates at or near zero percent, you have an option to position your money in a safe, liquid, tax-free cash value insurance policy with higher returns.
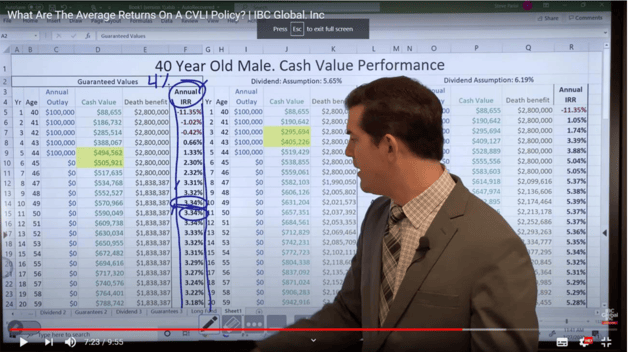
Now, the middle scenario below based on a dividend assumption of 5.65% we see a little over 4% at year 8 in Column L.
The scenario on the right, we’re projecting a more aggressive prediction with a potential of an index strategy that might boost returns. (Sidenote: When I say index strategy, just to be clear, we're not talking about indexed universal life insurance for a number of reasons. I'm not comfortable with those policy types, but that’s a discussion for a later date.)
So, my Annual IRR in Column R is around 5.3%. So, when I say index, you can index the dividend and have a dividend-paying whole life insurance policy.
The Wrap Up
Actual projections moving forward range from as conservative as possible to somewhat aggressive, in my opinion. We demonstrate that cash value policy design generates varying returns from Guaranteed Values section at 4%, compared to Middle Section at 5.65%, and to Dividend Assumption of 6.19%.
My position is to properly design whole life insurance policies with one of the four major mutual companies to maximize rates of return.
I had a great conversation with a top actuary and what he said surprised me, “it's better to go with a poorly designed policy with one of the big four insurance companies as opposed to a well-designed policy with a smaller company.” And that's just based on his data and studies he's done as actuary. It’s nice to see that a highly placed actuary is in agreement.
The key takeaway is that an intelligently designed cash value policy with one of the big four insurance companies can result in average returns of 3% to 5.5% IRR.
You can view a video presentation of “What are the Average Returns on Cash Value Life Insurance” on our YouTube channel.
Maximum cash value whole life insurance policies are flexible tax-free savings vehicles. Cash value funds can be accessed for emergency situations, used as tax-free loans, and act as an annuity during your retirement years. It can be particularly useful for times of economic uncertainty by providing safe, stable, tax-free returns.
You can also contact us for a free, no-obligation consultation from one of our Infinite Banking Specialists. Hope this helps reach out with any questions.
.png)